The MOVE Index: Wall Street’s Favorite Lie
Or how an obscure bond-volatility number became a security blanket for people who should know better.
The screens are always calm before something breaks.
No flashing red, no screaming volatility alert, no “systemic risk” headline yet. Just tight bid–ask spreads, muted price action, and some strategist on TV explaining why things are “constructive.”
That’s usually when the damage is quietly compounding.
And that’s the problem with the MOVE Index.
The Cult of the “Smarter” Vol Trader
There’s a smug little story that’s made its way from trading desks into podcasts and TikToks.
It goes like this:
Retail clowns watch the VIX.
Serious people watch MOVE.
MOVE — short for Merrill Lynch Option Volatility Estimate — is an index that tracks implied volatility on options tied to 2-, 5-, 10-, and 30‑year U.S. Treasuries. It’s now maintained by ICE, and it’s often called “the VIX of bonds.”
The narrative writes itself:
- Equities are noisy, emotional, silly.
- Bonds are sober, informed, and early.
- Bond traders “see it first.”
- Therefore: follow the MOVE Index and you’ll front‑run the next crisis.
Neat story. Too neat.
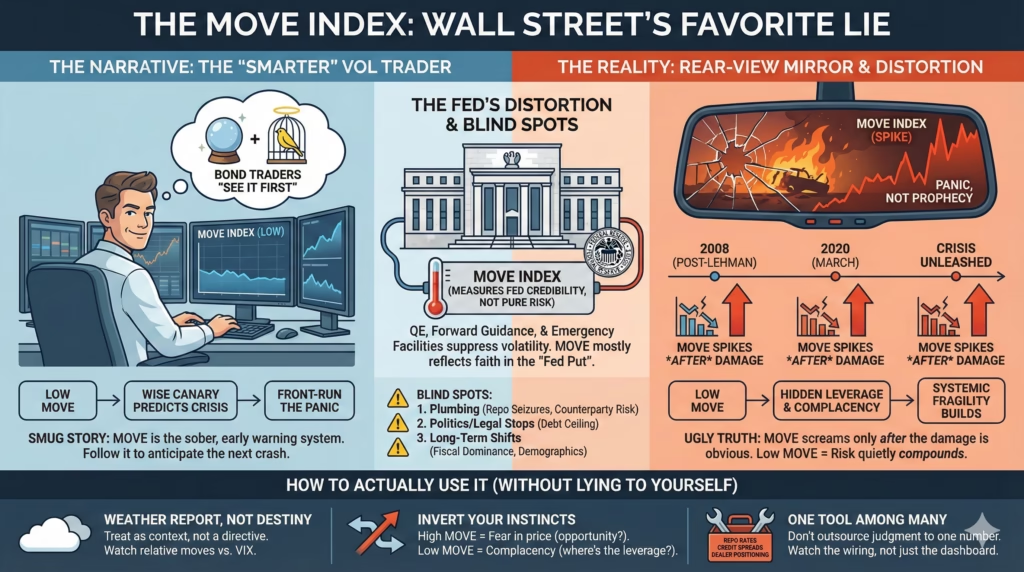
Because when you actually look at how crises unfold, MOVE behaves less like the wise canary in the coal mine and more like the guy yelling “fire” after the room is already half-empty.
- In 2007, before the financial system started to come apart, MOVE sat around 60. Comfortably dull.
- In October 2008, after Lehman, after the money-market funds broke the buck, after global equities were already down 30–40%, MOVE spiked above 250 (ICE data).
- In February–March 2020, the S&P 500 had already dropped more than 25% from its high before MOVE hit its peak near 160.
In every case, the index screamed only after the damage was obvious. Panic, not prophecy.
And while all that was brewing?
MOVE mostly looked “benign.”
The real pattern is ugly:
- Low or grindingly stable MOVE → risk quietly builds.
- Monster spikes in MOVE → risk is already being liquidated.
So when pundits talk about MOVE as the “ultimate fear gauge,” what they’re really worshipping is a rear-view mirror.
Volatility Is Not Risk (And That’s Where the Rot Starts)
A lot of this confusion comes down to a single category error: treating volatility as if it were risk.
Volatility is just the wiggle in prices. The standard deviation. The dispersion.
Risk is losing money you can’t afford to lose or blowing up the plumbing of the financial system.
Those are not the same thing.
When MOVE is high:
- Options on Treasuries are expensive.
- Hedging is socially acceptable.
- Leverage gets cut.
- Risk managers actually get invited to meetings.
- CIOs ask annoying questions about “gross vs net.”
In other words, the system is actively de‑risking. The car is skidding, but at least everyone has both hands on the wheel.
When MOVE is low:
- Vol-selling products look like free money.
- “Risk parity” funds lever up bonds because they look “low risk.”
- Corporates refinance at ultra‑low yields and push out maturities.
- Macro hedge funds run carry trades: borrow cheap, buy higher‑yielding stuff, hope nothing jumps.
Every one of those trades is short volatility in disguise. They make pennies as long as rate moves stay contained. Then, one day, somebody has to unwind in size, and you get the financial equivalent of a margin call in a crowded elevator.
So low MOVE doesn’t mean “low risk.”
Low MOVE means a lot of people are betting on low risk.
Those are very different situations.
The Bank for International Settlements has been warning about this dynamic for years. A 2018 BIS Quarterly Review piece on volatility-targeting and vol-selling strategies argued that these rules-based approaches can create mechanical selling pressure during spikes and amplify market moves rather than cushion them.
The data isn’t great here, and the effect sizes aren’t clean, but the direction of travel are pretty clear:
Enough capital now uses volatility as a control knob — “if MOVE > X, reduce risk by Y%” — that the indicator doesn’t just measure stress. It helps generate it.
MOVE doesn’t predict the storm.
It helps decide which ships have to dump cargo when the waves finally hit.
The Fed Turned the Thermostat Into a Hallucination
Most surface-level commentary on MOVE tosses in a disclaimer like:
“Of course, central bank intervention can distort volatility.”
As if that’s a side note.
It’s the whole story.
Since 2008, the Federal Reserve has been sitting on the Treasury market like an overly involved parent:
- Quantitative easing (QE): trillions of dollars of bond purchases, compressing yields and realized volatility.
- Forward guidance: explicit promises about the future path of rates, reducing uncertainty by design.
- Emergency facilities in 2008, 2020, and 2023: guarantees that, if spreads blow out, the Fed will do something.
So what does MOVE measure in this world?
Not “true” economic uncertainty.
Not the amount of hidden leverage.
Not the chance your portfolio gets torched.
It mostly measures how credible markets think the Fed still is.
- Low MOVE = traders believe the Fed Put still works. If something breaks, Powell & Co. will “adjust the stance of policy” and buy the dip indirectly.
- Spiking MOVE = the market is briefly testing whether the Fed is both willing and able to stop the bleeding.
Look at March 2020:
- Risk assets collapse.
- MOVE explodes higher.
- Fed announces massive QE, facilities for corporates, munis, and money markets.
- MOVE collapses, risk assets moon.
MOVE didn’t see the crash coming.
The crash forced the Fed’s hand, the Fed calmed things down, and now MOVE charts get used in PowerPoints as if the index foretold something. It didn’t. It just reacted loudly.
Even the Fed’s own researchers have been waving a warning flag about the underlying market. A 2022 Liberty Street Economics post from the New York Fed (“Has U.S. Treasury Market Liquidity Deteriorated?” by Adrian, Fleming, Stackman, and Vogt) showed that standard liquidity metrics — bid-ask spreads, price impact, order book depth — have been worse on average since 2020 than in the 2010s. You could lose an afternoon just wandering through that blog; the tone is dry, but the charts have a way of sticking in your head.
At the same time, primary dealer balance sheets haven’t kept up with the growth of Treasury supply or trading volumes. Dealers can’t warehouse as much risk, partly because of post‑2008 regulations, partly because their own risk managers enjoy sleeping at night.
So when MOVE spikes today, it increasingly tells you:
“Dealers are choking on duration and hedging is expensive.”
That’s not nothing. And—this is where people get carried away—it’s a far cry from:
“The all‑seeing bond market anticipates a global catastrophe.”
The thermometer is mostly recording the temperature in the server room, not outside.
When Everyone Watches the Same Gauge
Goodhart’s Law is one of those ideas that sounds like a tweet but keeps showing up in real life:
“When a measure becomes a target, it ceases to be a good measure.”
Originally, MOVE was an internal, slightly nerdy gauge used by rates desks and risk managers. If you knew it and others didn’t, it had some edge.
Today?
- MOVE has a ticker on Bloomberg, Reuters, TradingView.
- There are YouTube channels doing “MOVE Index Explained in 10 Minutes.”
- Substack posts tell you to “cut exposure when MOVE > 120.”
- Systematic funds bake MOVE thresholds into allocation rules.
The more capital that’s wired into the same trigger levels, the more predictable the flows become:
- If MOVE breaks 120, volatility-targeting funds reduce risk.
- Dealers know this, so some start to pre-hedge.
- Other macro funds lean into the pattern: “We know they have to sell here.”
- Option markets get pushed around not just by “fear” but by people anticipating other people’s rules.
At some point, the index stops telling you much about “the outlook” and starts telling you about positioning around the index itself.
You get a self‑licking ice cream cone: MOVE reacts to options demand that’s reacting to MOVE.
CFTC’s Commitments of Traders data add another wrinkle. Over the last decade, positioning in Treasury futures has become more concentrated among a smaller group of large players — hedge funds on one side, dealers and asset managers on the other. These are precisely the entities with the scale to move the option markets that feed into MOVE.
So you end up with:
- A relatively small number of big players
- Able to shift the prices of Treasury options
- Feeding an index watched religiously by people without that influence
The crowd thinks it’s reading the market.
The market, increasingly, is just reading the crowd.
What MOVE Will Never Show You
Even if MOVE were perfectly designed and pure and untouched by Fed distortions (it isn’t), it would still be blind to the things that actually kill you.
The big blowups usually start in the plumbing, not the price chart.
1. Counterparty landmines
MOVE doesn’t care whether your hedge is with a solvent counterparty.
In 2008, the real problem wasn’t that rates were volatile. It was that Lehman’s counterparties suddenly realized their CDS contracts and swaps might be worthless because the entity on the other side was gone.
Volatility didn’t destroy those portfolios.
The inability to collect when it mattered did.
MOVE can’t see that.
2. Funding market seizures
On September 17, 2019, overnight repo rates spiked to almost 10% intraday. The Fed had to intervene with emergency operations.
MOVE barely flinched.
In March 2020, the Treasury market — the “safest” market in the world — briefly turned into a fire sale. Dealers couldn’t or wouldn’t take inventory. Bid–ask spreads blew out. The Fed had to buy over $1 trillion of Treasuries in weeks.
Again: that was primarily a liquidity crisis, not a “rates outlook” crisis.
MOVE reacts to the hedging demand around that, sure. But the systemic stress happened in the pipes: repo, dealer balance sheets, collateral chains.
3. Politics and legal hard stops
Debt ceiling brinkmanship, sanctions, capital controls, sudden regulatory moves — these aren’t “mean-reverting volatility events.” They’re discontinuities.
A missed Treasury payment because of congressional theater?
That’s not a volatility spike. That’s a regime change.
Option markets respond only when there’s enough probability attached to the event. Often by then, everyone’s already arguing about it on TV.
MOVE will move, so will your face when you see the headline.
4. Correlations that snap
Most of the risk models built during the 2010s relied—politely—on the assumption that stocks and bonds tend to move in opposite directions. That’s the foundation of the classic 60/40 portfolio.
In 2022, both sides went down together. The Bloomberg U.S. Aggregate Bond Index had its worst year on record, down around 13%, while the S&P 500 fell about 19%.
MOVE was elevated, sure. But it didn’t tell you the only thing that mattered:
“Your hedge is not a hedge anymore.”
When correlations structurally change, volatility indices just describe the mess. They don’t warn you that the playbook itself is obsolete.
MOVE’s Time Horizon Problem
There’s another, quieter mismatch: the timescale.
The options that feed into MOVE are mostly short‑dated, typically around 1–3 months. The index answers a narrow question:
“How much could Treasury yields wiggle over the next few weeks to months?”
But a lot of the real risk in the system lives either at very short or very long horizons.
- Very short: flash crashes, fat fingers, algo loops. These happen in seconds or minutes. By the time 1‑month options reprice, it’s over.
- Very long: demographics, entitlement spending, climate risk, de‑globalization, reserve currency shifts. These unfold over years or decades with long stretches of apparent calm.
MOVE is laser‑tuned to the middle distance. Unfortunately, that’s not where most existential problems lurk.
Take U.S. fiscal dynamics right now:
- Federal debt is over $34 trillion.
- Debt-to-GDP is hovering around 120%, depending on the measure.
- Net interest expense as a share of tax revenue is climbing as old debt rolls into higher coupons.
- Foreign official holdings of Treasuries, as a share of the total, are lower than in the 2000s, according to Treasury data.
A 2024 Brookings Institution analysis of Treasury auctions highlighted something subtle but important: “tails” — where auction yields come in meaningfully above pre‑auction trading levels — have become more frequent and pronounced in some maturities.
That’s not a crash. It’s not a panic. It’s a slow repricing of who actually wants to hold U.S. debt and at what yield.
MOVE will eventually reflect more turbulence if the market starts to choke on issuance. By the time you see a sustained step‑change higher, the underlying shift in demand will have been in motion for years.
A short-dated options index is just the wrong lens for that.
New Regime, Old Thresholds
All those sexy “rules of thumb” people quote:
- MOVE below 80 = “Green light, all clear.”
- MOVE 80–120 = “Normal stress, stay nimble.”
- MOVE above 120 = “Danger, reduce risk.”
Where did those numbers come from?
Mostly from the period between 2009 and 2021:
- Zero (or near-zero) policy rates
- Multiple rounds of QE
- Inflation that rarely stuck above 2%
- A Fed that could always cut, print, and soothe without worrying about food and rent prices spiking
The entire regime was:
“If anything breaks, the Fed steps in and nobody really yells about inflation.”
That world ended in 2021–2022.
Now you’re in something closer to fiscal dominance:
- Fiscal policy (government deficits) is so large and persistent that it effectively drives the stance of monetary policy.
- The Fed has to think twice about opening the QE firehose because inflation is still a political and economic problem, not a ghost from the 1970s.
- Treasury supply is structurally high, just as some traditional buyers (foreign central banks, price‑insensitive domestic institutions) are less eager.
In this world, a MOVE reading of 90 doesn’t mean what 90 meant in 2015.
Back then, it said:
“A bit of excitement in a world where the central bank owns the fire extinguisher.”
Now it can mean:
“The market is trying to price a fiscally messy, geopolitically fragmented future, and nobody knows what the Fed can do, even if it wants to help.”
Same number. Completely different movie.
Anyone who insists the old thresholds still apply is reciting, not thinking.
The Inversion: When MOVE Is Most Useful
If MOVE has any use as a signal — and it does, just not the one being sold — it’s mostly contrarian.
Look at history:
- When MOVE explodes above ~150–180, it tends to do so after something very bad has already happened.
- Forward 1–3 year returns from those points in broad risk assets have often been solid, because you’re usually buying into forced selling and panic.
- Conversely, long stretches where MOVE grinds along at suppressed levels have been the launchpads for ugly surprises: pre‑2008, 2017–early 2018, late 2019–early 2020.
So the uncomfortable read is:
- High MOVE = “Fear is in the price; look for what’s being thrown away.”
- Low MOVE = “Complacency is in the price; ask where leverage is hiding.”
That doesn’t mean you blindly “buy when MOVE > 150” and “sell when MOVE < 70.” Markets don’t hand out that kind of easy allowance forever.
It does suggest this:
If everyone on TV is suddenly talking about the MOVE Index, the explosion has already happened and the risk is probably shifting from “sudden crash” to “opportunity you’re too traumatized to take”; when MOVE disappears from the conversation for months — when the line on the chart is boring and flat — that’s when you should probably start asking the impolite questions:
- Who’s short vol, explicitly or implicitly?
- Who’s funding at overnight, rolling the dice on stable conditions?
- What “safe” strategies have quietly become one‑way bets?
To use MOVE intelligently, you almost have to invert your instincts.
What People Who’ve Moved Past MOVE Actually Watch
Serious macro traders and risk people don’t ignore MOVE, but it’s background noise. It’s the weather, not the map.
They obsess over things that never trend on financial Twitter but decide whether crises stop or cascade.
A few of the big ones:
1. Funding stress and repo markets
Overnight funding rates, tri-party repo volumes, the spread between secured and unsecured borrowing — these are the vital signs.
When repo blew out in September 2019, overnight rates briefly traded near 10%. That wasn’t a “volatility spike”; it was a sudden realization that balance sheet and collateral constraints were binding hard.
If repo breaks, everything priced off it is in question. MOVE comes later.
2. Treasury auction quality
When the U.S. Treasury sells a new batch of notes or bonds, the market watches:
- Bid-to-cover ratios
- Tails (how far the auction yield is above/below pre‑auction trading)
- Participation by primary dealers vs indirect bidders (often foreign accounts)
Widening tails and weak demand are the market’s way of whispering:
“We’re going to need higher yields to eat this supply.”
That’s fiscal and structural risk, not just vol.
3. Dealer positioning and basis trades
CFTC data on futures, plus street color, can show when:
- Dealers are choked with a particular duration bucket
- Hedge funds are running large “basis trades” (long cash Treasuries, short futures, funded in repo)
- Risk is piled on the same side of the seesaw
The March 2020 Treasury meltdown was heavily tied to levered basis trades that had to be unwound all at once. MOVE reacted, again, but the fragility was in balance sheets and repo desks.
4. Cross‑currency basis
The cross‑currency basis is a nerdy but powerful gauge of how badly institutions outside the U.S. want dollars.
When, say, Japanese or European institutions have to pay up to swap their local currency into dollars, it shows stress in global dollar funding.
That stress can force asset sales far away from where you’re looking.
5. Credit spreads
If your actual risk is equity drawdowns and economic pain, credit spreads — especially high-yield and leveraged loans — are usually more honest than rates vol.
- Widening spreads = funding costs rising for weaker companies, defaults more likely.
- Tight spreads in the face of obvious macro risk = someone is probably underpricing default.
MOVE might tell you that rate paths are uncertain. Credit tells you who can’t survive most of those paths.
The common theme across all of this:
They measure who might break, not just how jumpy prices are.
The Real Hazard: Outsourcing Judgment to One Number
The biggest risk with MOVE — or with any “ultimate fear gauge” — isn’t misreading the index.
It’s believing an index can keep you safe at all.
The appeal is obvious:
One line, one level, one rule.
- MOVE below X → relax.
- MOVE above Y → panic.
- Sleep better at night thinking risk management is just an alert on your phone.
That’s not risk management. That’s superstition with better branding.
Sophisticated investors use indicators as conversation starters, not commandments.
They ask:
- “What would have to be true for this MOVE spike be meaningful?”
- “Who is on the wrong side of this move, structurally?”
- “Is this hedging demand, dealer balance-sheets, or macro fear?”
- “Is this about rates, or is it about funding and liquidity under the hood?”
Some of this is guesswork and seat-of-the-pants—look, nobody really likes to admit that—but that’s how markets actually gets navigated.
The difference is subtle but important:
- The indicator‑follower asks: “What is MOVE telling me to do?”
- The framework‑builder asks: “What is MOVE possibly reflecting, and does that fit with everything else I see?”
One abdicates judgment.
The other uses the index as a single clue in a much bigger puzzle.
How to Use MOVE Without Lying to Yourself
If you’re going to keep an eye on MOVE — and there’s no shame in that, just in worshipping it — a more honest approach looks something like:
- Treat level as context, not signal.
MOVE at 70 vs 150 tells you how much the options market is charging for insurance. That’s interesting. It is not a trading plan. - Pay attention to relative moves.
MOVE surging while VIX is sleepy? That can mean fixed income is waking up to something equities haven’t digested yet. Or vice versa. The divergence is sometimes more informative than either number. - Use extremes as a mirror, not a trigger.
Very low readings: ask where carry and leverage live in your own portfolio and in the broader system.
Very high readings: ask what you’re too scared to buy. - Remember the blind spots.
MOVE says almost nothing about counterparty chains, regulatory rug pulls, or a repo market seizure at 9:30 a.m. on a random Tuesday. - Stay regime‑aware.
Don’t transplant thresholds from a ZIRP+QE world into a fiscal‑dominant, inflation‑sensitive one without thinking. The same number can mean different things across regimes.
None of that fits nicely on a trading infographic. That’s the point.
So, What Do You Do With All This?
The MOVE Index isn’t fraud. It’s not noise. It’s just overpromoted and misused.
It tells you something real about how the market is pricing near‑term Treasury volatility and hedging. In heavy stress, it will scream. In long quiet stretches, it will purr.
The trouble starts when you treat that purr or that scream as a directive rather than a symptom.
If there’s a “lesson” here — and maybe there isn’t a clean one — it’s this:
- Be more afraid when everyone is calm and hedges are cheap.
- Be more curious when everyone is terrified and protection costs a fortune.
- Use indices like MOVE as weather reports, not destiny.
The real canary in the coal mine these days isn’t a volatility index.
It’s the moment everyone around you nods and agrees that some single number — MOVE, VIX, whatever — has it covered.
That’s when you know people have stopped looking at the wiring and started staring at the dashboard.
And markets don’t usually blow up because the dashboard was too noisy. They blow up because, for a long time, it looked reassuringly still.