IDV vs EFAS: The International Dividend ETF Showdown Nobody Wants to Settle

You came here for an answer. Here it is: IDV beats EFAS for almost everyone. Now let’s talk about why — and why the more interesting question is whether you should own either.
The Quick Verdict
IDV (iShares International Select Dividend) holds about 100 stocks. EFAS (Global X MSCI SuperDividend EAFE) holds about 50, and chases the fattest yields it can find across Europe, Australasia and the Far East.
That sounds appealing until you remember what “highest yield in the room” usually means. Stretched payout ratios. Companies funding dividends with debt or asset sales. The screening logic that built EFAS actively rewards fragility. When something cracks, EFAS cracks first.
IDV isn’t a masterpiece either — same backward-looking yield obsession, just less aggressive. But it’s broader, more liquid, and exits cleanly when you need it to. EFAS has thinner volume and wider spreads. In a 2020-style panic, getting out of EFAS could cost you months of yield in a single trade.
Verdict: If you must pick one, pick IDV. Use EFAS only as a small satellite, if at all.
The “International Dividend” ETF Is Wearing a Costume
You came here for an answer. Here it is: if you bought IDV for “boring income,” you bought oil, sterling, and Korean memory chips with a yield sticker glued on the box. Now let’s talk about what that actually means for your money.
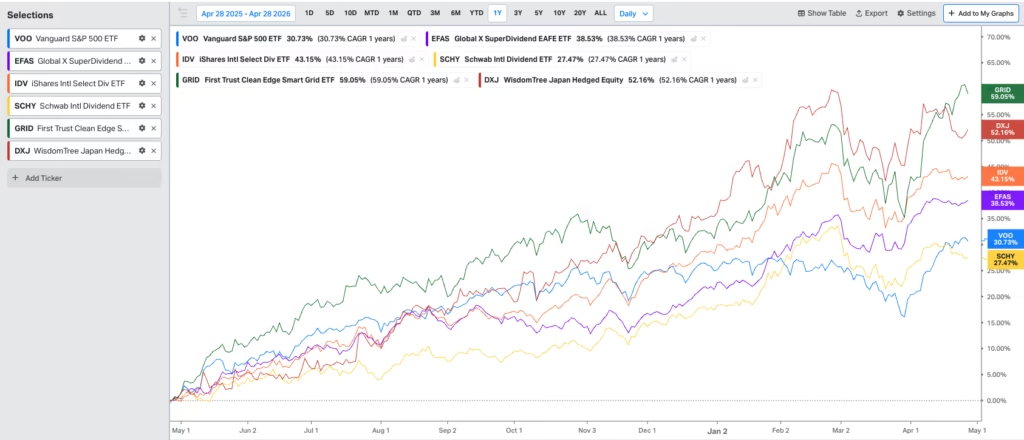
IDV ripped roughly 44% over the trailing twelve months. Every allocator on the planet has rediscovered that countries exist outside the United States. The pitch sells itself — defensive yield, geographic diversification, dollar hedge, sleep-at-night money.
The pitch is wrong. You’re holding a leveraged stack of three trades dressed up as a dividend fund.
What You Actually Own
Pull IDV’s 44% apart and the pieces look nothing like income.
Local equity gains did maybe 15-20%. A weakening dollar added another 10. Energy and materials beta — Brent above $100, the Strait of Hormuz a mess — piled on more. The dividend itself contributed about a tenth of the total return.
You bought three things stapled together: a weak dollar, a commodity supercycle, and European value rotation. The yield is a coincidence. A pleasant one, but a coincidence.
That misidentification is where risk management dies. Your “defensive 5% in international dividends” is behaving like a 5% bet on oil, sterling, and the Korean memory cycle. When one leg reverses, the drawdown will not feel defensive. It will feel like every other commodity-currency trade you’ve ever held — sharp, ugly, and faster than you can react.
IDV vs EFAS: Same Costume, Different Bodies
They look interchangeable on a fact sheet. They aren’t.
IDV holds about 100 high-yield developed ex-US names, weighted by size. Heavy UK (~19%), heavy Europe, heavy Australia. Concentrated in banks, oil, miners, utilities. Around $8.3 billion in assets. Real liquidity.
EFAS holds about 60 dividend growers — a different screen entirely. Broader sector spread, monthly distributions. Around $46 million in assets.
That last number is the problem. A $46 million ETF in 2026 is a closure candidate, not a peer. The gap between buy and sell prices eats the headline yield. Institutions can’t get in or out without moving the price. In the exact stress scenario where you’d want to sell, EFAS faces redemption friction that blows out the spread between the fund’s price and what its holdings are worth.
EFAS is a different product altogether. Too small to trust when you’d actually need it.
What the Oil Mess Is Doing Inside IDV
The geopolitical premium is doing real work under the hood.
European integrated oil majors — TotalEnergies, Eni, Shell, Equinor, Repsol — are booking windfall earnings at Brent above $100. Those earnings fund 2026 dividends regardless of where oil sits next year. Cash already in the door, money in the mattress.
UK banks — HSBC, Standard Chartered, Lloyds — are the quiet beneficiaries nobody discusses at dinner parties. Disrupted trade routes make trade finance more complex and more profitable. Sticky inflation keeps rates higher for longer, fattening the spread banks earn on lending. London’s role as global middleman gets more valuable when the plumbing gets clogged.
Australian and Norwegian commodity exporters: obvious winners, no further comment needed.
Now look at who loses in an oil shock. Net importers. German automakers. Japanese manufacturers. IDV’s yield screen accidentally tilts away from those names. EFAS, screening for dividend growers, tilts toward them. Wrong tilt for a stagflation shock.
The Trap Most Writers Miss
Conventional wisdom says screen for “dividend traps” — high yields signaling earnings decay. Fine advice. It misses the bigger problem.
IDV’s holdings are deeply cyclical businesses paying out cash at a peak. Banks at peak margins. Miners at peak commodity prices. Oil majors at triple-digit Brent. The dividends are perfectly safe today. They become unsafe two years from now, when the cycle turns. By then the screen has already repriced and you’re holding the bag.
A 6% yield, in this setup, is a coincident indicator of cyclical peak. It is not a forecast.
The Trade Is Now Consensus
April 2024, “diversify away from the US” was contrarian. April 2026, Vanguard, BlackRock, and JP Morgan are all overweight ex-US. The 44% trailing return marks the completion of that rotation, not the start of it.
The marginal buyer is the US 60/40 investor mechanically lifting international weight. Mechanical buyers become mechanical sellers the moment the trend cracks. They don’t think. They rebalance.
The Cold Answer
If your thesis is “ex-American resilience under geopolitical and oil stress,” IDV is the structurally correct vehicle of the two — but for reasons that have nothing to do with dividends. Its accidental overweight to UK banks, European oil majors, and Australian miners makes it a crude proxy for crisis-beneficiary developed markets. The yield is window dressing on a commodity-and-currency trade.
EFAS is the wrong tool in this regime. Liquidity risk plus a construction tilt toward importers and consumer-facing names makes it a mismatch with the macro setup. Avoid.
Three realities worth chewing on before you click buy:
- In 2008, 2020, and 2022, US and ex-US equities moved together more than 85% of the time. The “diversification” collapses precisely when you need it.
- Foreign tax withholding shaves 15-30% off the headline dividend depending on your account and the relevant tax treaty.
- Currency moves dominate equity moves over one-to-three-year windows. If the dollar bottoms, unhedged international ETFs lose 5-10% on currency alone while the underlying stocks go nowhere.
Was IDV a good bet in 2024? Yes. Today it’s a consensus bet wearing a defensive label, with the easy money already booked and three reversal risks lined up like dominoes — dollar bottom, oil normalization, cyclical peak. If you own it, know what you own. If you’re buying now, size it like a commodity-currency position, not a bond substitute.
📓 LEXICON FOR THE UNINITIATED
ETF — Exchange Traded Fund. A basket of stocks you buy as one ticker. Cheap, easy, traded like a stock.
IDV / EFAS — Two specific ETFs. IDV (iShares International Select Dividend) holds 100 high-yield foreign companies. EFAS (Global X MSCI SuperDividend EAFE) holds 60 foreign dividend growers. Different recipes, very different sizes.
AUM (Assets Under Management) — How much money is parked in the fund. Bigger usually means safer to trade.
Yield — The dividend a company pays, expressed as a percentage of the stock price. A 6% yield means $6 per year for every $100 invested. Sounds simple, hides a lot.
Bid-ask spread — The gap between what buyers offer and what sellers ask. The wider the gap, the more it costs you to trade. Tiny ETFs have ugly spreads.
Cyclical business — A company whose profits boom in good times and crater in bad ones. Banks, miners, oil — the classic offenders.
Brent — The European benchmark for oil prices. When you read “oil at $100,” they usually mean Brent.
Net interest margin — The spread banks earn between what they pay depositors and what they charge borrowers. Higher rates, fatter margin.
Withholding tax — Foreign governments take a cut of dividends paid to American investors before the money hits your account. Treaty rates vary. Always smaller than you think.
60/40 portfolio — The classic mix: 60% stocks, 40% bonds. Most American retirement money is allocated this way, give or take.
Float — The shares actually available to trade in the open market. Small float plus heavy buying equals reflexive price moves.
🧭 LATERAL READING & WATCHLIST
Companies inside the trade
- TotalEnergies, Eni, Shell, Equinor, Repsol — European oil majors anchoring IDV’s energy weight. 2026 dividends already funded by today’s windfall. Coverage holds through a moderate oil pullback.
- HSBC, Standard Chartered, Lloyds — UK banks profiting from messy trade routes and stubborn inflation. The non-obvious winners.
- BHP, Rio Tinto — Mining giants paying out cyclical-peak cash. Enjoy the dividend, watch the exit.
- Iberdrola, Enel, E.ON — European utilities sitting on the forgotten side of the AI infrastructure trade. Cheap versus US peers running the same playbook.
Equinor deserves its own line — Norwegian sovereign wealth, US dividend ETFs, and global passive funds are all bidding the same modest float. Tailwind now, crowded exit later.
To go deeper
- Capital Returns by Edward Chancellor — the bible on cyclical capital allocation. Reading it is like getting a flashlight in a cave.
- Devil Take the Hindmost — same author, history of financial manias. Useful when consensus feels comfortable.
- The Dao of Capital by Mark Spitznagel — for understanding why crowded “defensive” trades blow up.
- Currency-hedged alternatives: HEFA, IHDG. Same exposures, different bet on the dollar.
- Aggregate Confusion (Berg, Kölbel, Rigobon) — academic paper on how index construction quietly drives outcomes nobody intended. Relevant any time you trust a fact sheet.
Coffee’s gone. So’s the patience.