A personal archive of stock ideas and market analysis, focused on swing-trade dynamics.
Not financial advice.
Research blends LLM-assisted document analysis with my own notes.
A personal archive of stock ideas and market analysis, focused on swing-trade dynamics.
Not financial advice.
Research blends LLM-assisted document analysis with my own notes.
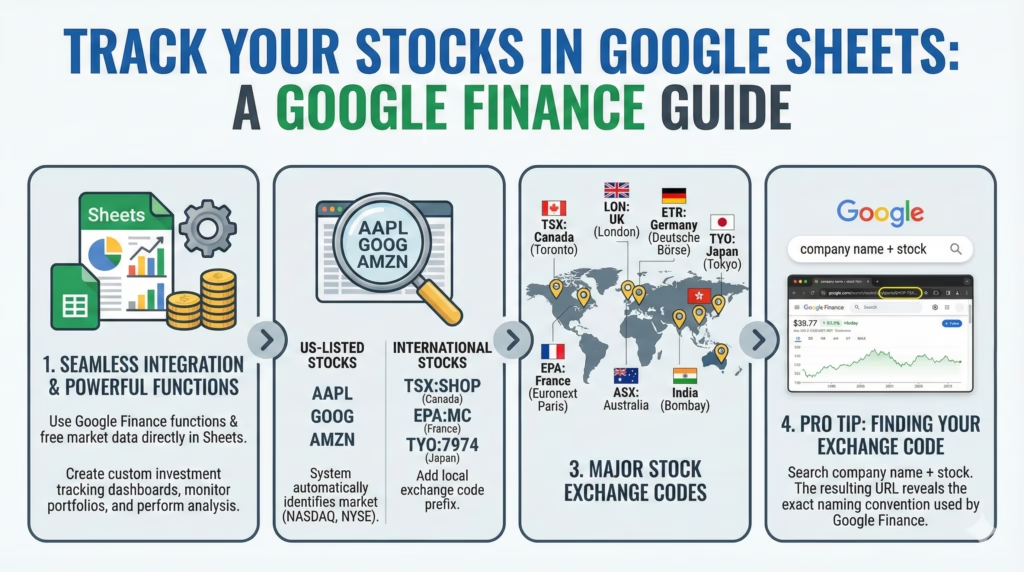
How to Use Google Finance: Track Your Stocks in Google Sheets
Google provides a suite of powerful financial functions and free market data that seamlessly integrates into Google Sheets—giving you the perfect opportunity to create custom investment tracking dashboards. Whether you’re managing a personal portfolio, day trading, or conducting fundamental analysis, Google Finance transforms spreadsheets into dynamic financial tools.
With Google Finance’s advanced capabilities, you can visualize your entire investment portfolio in a single Google Sheet, manipulate real-time market data, and build completely customized financial tracking documents. It’s an ideal solution for improving your trading strategy and investment decision-making.
Getting Started: Google Finance Basics
Understanding Ticker Symbols
Google Finance functions work by using stock ticker symbols. For US-listed stocks, the system automatically identifies the market (NASDAQ, NYSE, etc.). However, for international stocks, you’ll need to add the local exchange code prefix.
Major Stock Exchange Codes
TSE: Toronto Stock Exchange (Canada)
EPA: Euronext Paris (France)
ASX: Australian Securities Exchange
LON: London Stock Exchange (UK)
ETR: Deutsche Börse (Germany)
TYO: Tokyo Stock Exchange (Japan)
HKG: Hong Kong Stock Exchange
BSE: Bombay Stock Exchange (India)
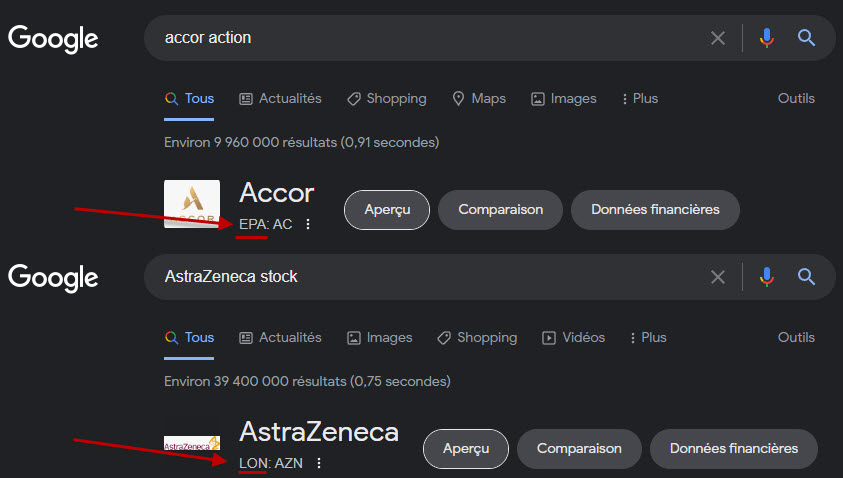
Pro Tip: Finding Your Exchange Code
Search for the company name in Google or type “company name + stock” and you’ll see a link to the current price. The URL uses the same naming convention as Google Finance functions.
Cryptocurrency Support
While there are some limitations, cryptocurrencies are available in Google Finance as currency pairs. For example, “BTCUSD” tracks Bitcoin against the US Dollar, “ETHUSD” for Ethereum, and “SOLUSD” for Solana. You can also track pairs like “BTCEUR” for Bitcoin in Euros.
Note: Not all Google Finance attributes work with cryptocurrency tickers, particularly fundamental metrics like P/E ratio or market cap.
Essential Google Finance Formulas
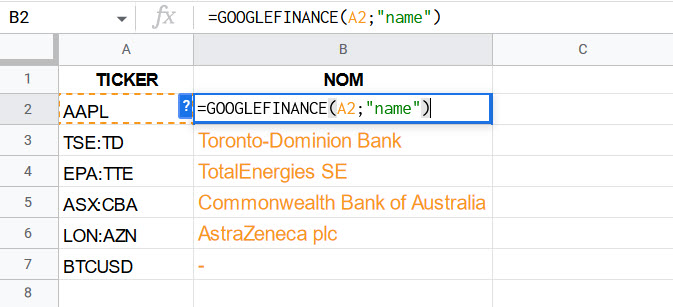
Getting Company Names
Formula: =GOOGLEFINANCE(A2,”name”)
This formula retrieves the full company name from a ticker symbol. Simply reference the cell containing your ticker (like AAPL for Apple Inc.) and the function returns the complete company name.
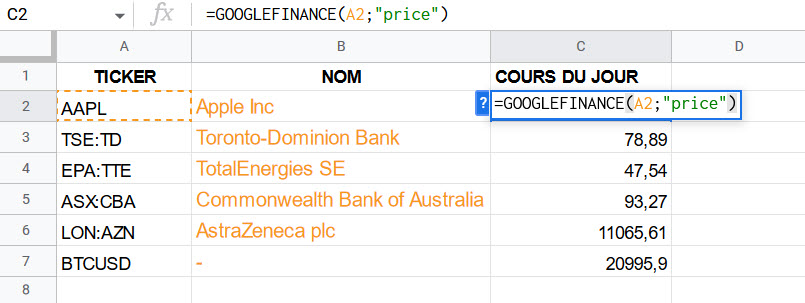
Real-Time Stock Prices
Formula: =GOOGLEFINANCE(A2,”price”)
The “price” attribute fetches the current trading price for each ticker, including cryptocurrency pairs like BTCUSD.
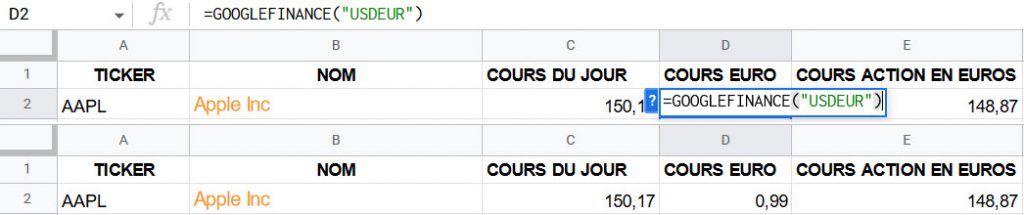
Currency Conversion
Currency Warning: Google Finance returns prices in the local currency of the stock exchange. If you’re tracking international stocks and need everything in one currency, you’ll need to add a currency conversion column.
To convert AAPL’s price from USD to EUR, create a column with: =GOOGLEFINANCE(“USDEUR”)
Then multiply your USD price by this exchange rate to get the Euro equivalent.
Important: When you’re not referencing a cell, use quotation marks around the ticker: =GOOGLEFINANCE(“USDEUR”)
Apply custom currency formatting via Format > Number > Custom currency to display values correctly.
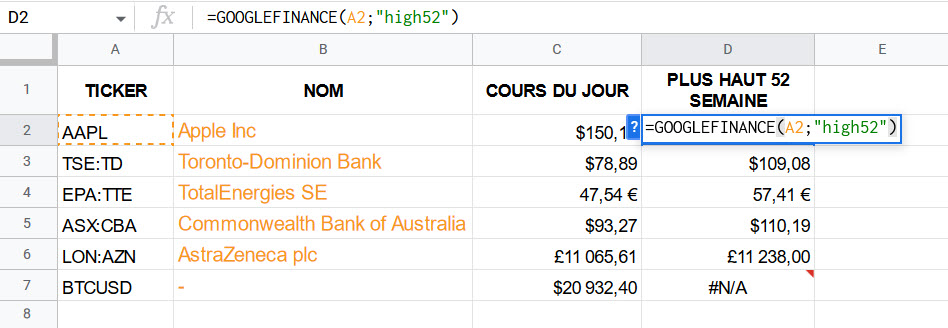
52-Week High and Low
Formulas:
52-Week High: =GOOGLEFINANCE(A2,”high52″)
52-Week Low: =GOOGLEFINANCE(A2,”low52″)
These functions return the highest and lowest trading prices over the past 52 weeks. Note that this doesn’t work for all tickers, particularly cryptocurrencies.
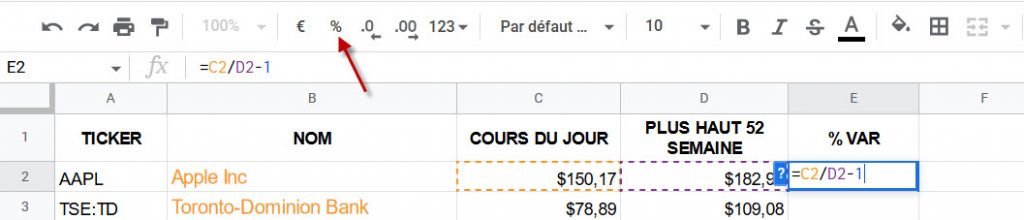
Calculating Distance % from 52-Week High
Formula: =C2/D2-1 (then format as percentage)
This calculation shows how far below (or above) the 52-week high each stock is currently trading—a useful metric for identifying potential buying opportunities or overbought conditions.
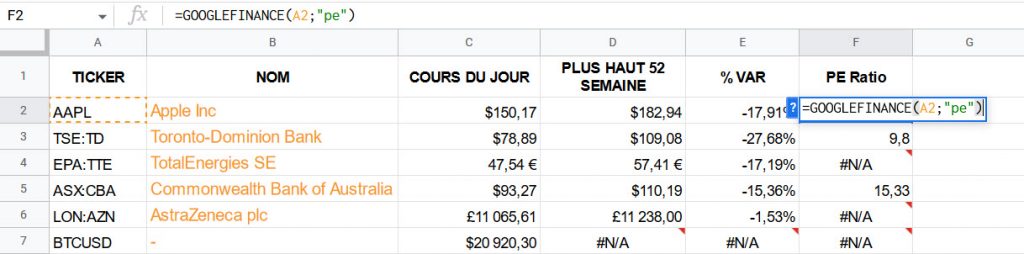
Price-to-Earnings (P/E) Ratio
Formula: =GOOGLEFINANCE(A2,”pe”)
The P/E ratio indicates a stock’s valuation by dividing its share price by earnings per share. It shows how much investors are willing to pay per dollar of earnings.
Limitation: P/E ratios aren’t available for all exchanges. Google Finance prioritizes US market data, so international exchanges like Paris (EPA) or London (LON) may not return P/E ratios.
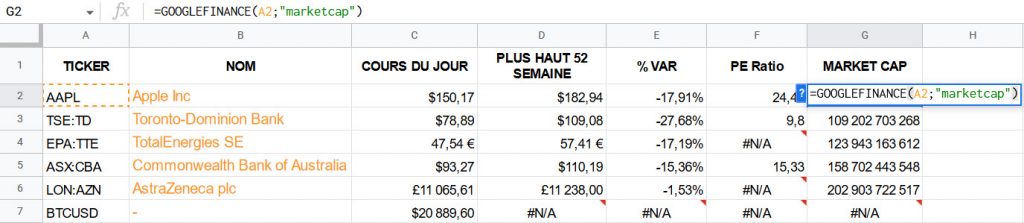
Market Capitalization
Formula: =GOOGLEFINANCE(A2,”marketcap”)
Market cap provides instant insight into a company’s size and classification—large-cap, mid-cap, or small-cap—each carrying different risk profiles and growth potential.
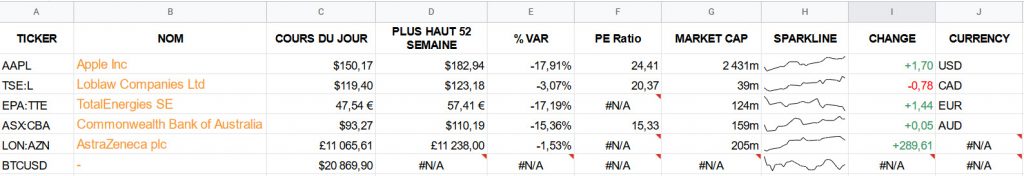
Formatting Market Cap for Readability
To display values in millions/billions:
Go to Format > Number > Custom number format
Enter: #,##0.0,,”M” for millions or #,##0.0,,,”B” for billions
This divides the number by 1,000 (per comma) and adds an “M” or “B” suffix for cleaner presentation.
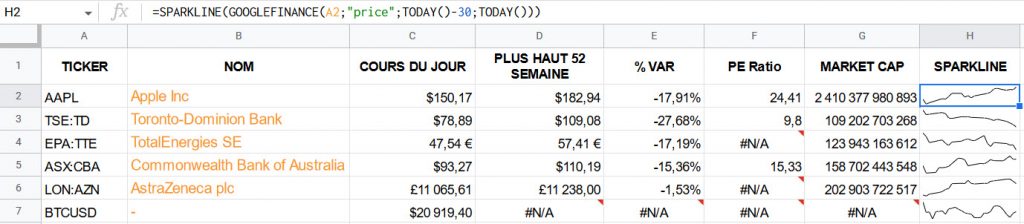
A sparkline is a miniature chart embedded in a cell that provides visual trend analysis. This formula creates a 30-day rolling price chart for each ticker, making it easy to spot momentum and volatility at a glance.
Customizing Sparklines
You can customize sparklines with additional parameters:
Change timeframe: Replace 30 with any number of days
Add color: =SPARKLINE(data, {“color”, “green”})
Show high/low points: {“highcolor”, “red”; “lowcolor”, “blue”}
Tracking Daily Price Changes
Formula: =GOOGLEFINANCE(A2,”change”)
This returns the absolute dollar change for the trading day. Combine with conditional formatting for visual impact.
Color-Coded Conditional Formatting
Create dynamic color-coded cells:
Go to Format > Number > Custom number format
Enter: [color50]+#,##0.00;[red]-#,##0.00;-
This displays gains in green and losses in red automatically.
Other Useful Attributes
Currency: =GOOGLEFINANCE(A2,”currency”) — Returns the trading currency
This creates a two-column table with dates and corresponding prices for the past 30 days. You can extend the range to get months or years of historical data for backtesting strategies.
High/Low/Close: Use “high”, “low”, or “close” as the attribute
Multiple attributes: Use “all” to get open, high, low, close, and volume
Data Quality and Reliability
How Fresh Is the Data?
Google Finance advertises a maximum delay of 20 minutes. In practice, most US and Canadian stock prices update in real-time or near real-time. However, you’ll need to refresh your spreadsheet (press F5 or Cmd+R) to pull the latest values.
International markets: Data for European, Asian, and other markets may have longer delays and less consistent updates.
Service Availability Issues
Occasionally, all Google Finance formulas in your sheet may return errors. This typically resolves within a few hours after refreshing the page. While rare, these outages can be problematic when you need real-time data for trading decisions.
Best Practice: Don’t rely exclusively on Google Finance for time-sensitive trading. Have backup data sources or use professional trading platforms for critical decisions. Google Finance is excellent for portfolio tracking and analysis but isn’t guaranteed for mission-critical applications.
Complete Google Finance Attribute Reference
You’ll find a complete listing of available attributes in Google’s official help documentation. However, many documented attributes no longer work reliably. Google Finance is somewhat of a testing ground for Google’s teams and doesn’t receive the same level of support as other Google services.
Example: The “morningstarrating” function once provided Morningstar ratings for stocks—incredibly useful—but has been deprecated. It may return in future updates.
Most Stable and Reliable Attributes (2026)
Based on extensive testing, here are the most consistently working attributes:
Attribute
Function & Description
name
Returns the full company name
price
Returns the current trading price
high52
Returns the 52-week high price
low52
Returns the 52-week low price
pe
Returns the price-to-earnings ratio
eps
Returns earnings per share
marketcap
Returns the market capitalization
currency
Indicates the trading currency
change
Returns the daily price change (absolute)
changepct
Returns the daily price change (percentage)
volume
Returns the trading volume for the day
beta
Returns the beta coefficient (volatility measure)
high
Returns the day’s high price
low
Returns the day’s low price
datahigh
Returns the highest price in the query date range
datalow
Returns the lowest price in the query date range
Note on reliability: I’ve tested dozens of additional attributes, but many stop working without warning. The attributes listed above have proven to be the most stable over time. Your mileage may vary with international exchanges.
Building Your Custom Portfolio Tracker
Essential Columns to Include
For a comprehensive portfolio tracker, consider including:
Ticker symbol and company name
Current price and currency
Number of shares owned
Purchase price and date
Current position value (shares × current price)
Total gain/loss ($ and %)
Daily change and 30-day sparkline
Market cap and P/E ratio
Portfolio allocation percentage
Advanced Features to Consider
Automatic Rebalancing Alerts: Use conditional formatting to highlight positions that have grown beyond your target allocation
Tax Lot Tracking: Separate rows for different purchase dates to track cost basis for tax purposes
Dividend Tracking: While Google Finance doesn’t provide dividend data directly, you can manually add dividend columns
Performance Benchmarking: Compare your returns against S&P 500 (ticker: .INX) or other indices
Currency Hedging: Track FX exposure and calculate currency-adjusted returns for international holdings
Pro Tips and Best Practices
1. Use Named Ranges for Cleaner Formulas
Instead of =GOOGLEFINANCE(A2,”price”), create a named range “Tickers” for column A, then use =GOOGLEFINANCE(Tickers,”price”). This makes formulas more readable and easier to maintain.
2. Leverage Array Formulas
For multiple stocks, use: =ARRAYFORMULA(GOOGLEFINANCE(A2:A10,”price”)) to populate an entire range with a single formula. This reduces sheet complexity and improves performance.
3. Schedule Automatic Refreshes
Use Google Apps Script to create a time-driven trigger that automatically refreshes your sheet every hour during trading hours. This ensures you always have current data without manual intervention.
4. Create Drop-Down Lists for Quick Analysis
Use data validation to create dropdown lists of your tickers. Combined with VLOOKUP or INDEX/MATCH, you can quickly pull detailed analysis for any stock in your portfolio.
5. Protect Your Formulas
Use sheet protection to lock cells containing formulas while leaving input cells (like share quantities) editable. This prevents accidental deletion of your carefully crafted formulas.
Beyond Google Finance: Alternative Solutions
While Google Finance is powerful and free, consider these alternatives for more robust needs:
Yahoo Finance API: More comprehensive data, especially for dividends and splits
Alpha Vantage: Free tier with technical indicators and fundamental data
IEX Cloud: Professional-grade data with reliable uptime and extensive coverage
Finnhub: Great for real-time data and news sentiment analysis
Polygon.io: Excellent for algorithmic trading with historical data and WebSocket support
Conclusion: Maximize Your Investment Analysis
Google Finance transforms Google Sheets into a powerful, customizable investment platform. By combining real-time market data with spreadsheet functionality, you can build sophisticated portfolio trackers, conduct fundamental analysis, and make more informed investment decisions—all for free.
The key to success is starting simple and iterating. Begin with basic price tracking, then gradually add features like sparklines, conditional formatting, and calculated metrics as you become comfortable with the formulas.
Remember: Google Finance is a tool, not a guaranteed service. While it’s excellent for portfolio tracking and analysis, maintain backup data sources for critical trading decisions.
Now it’s your turn to experiment and build the perfect tracking system for your investment style. Start with these formulas, customize the layout to your preferences, and watch your portfolio management reach new levels of efficiency!