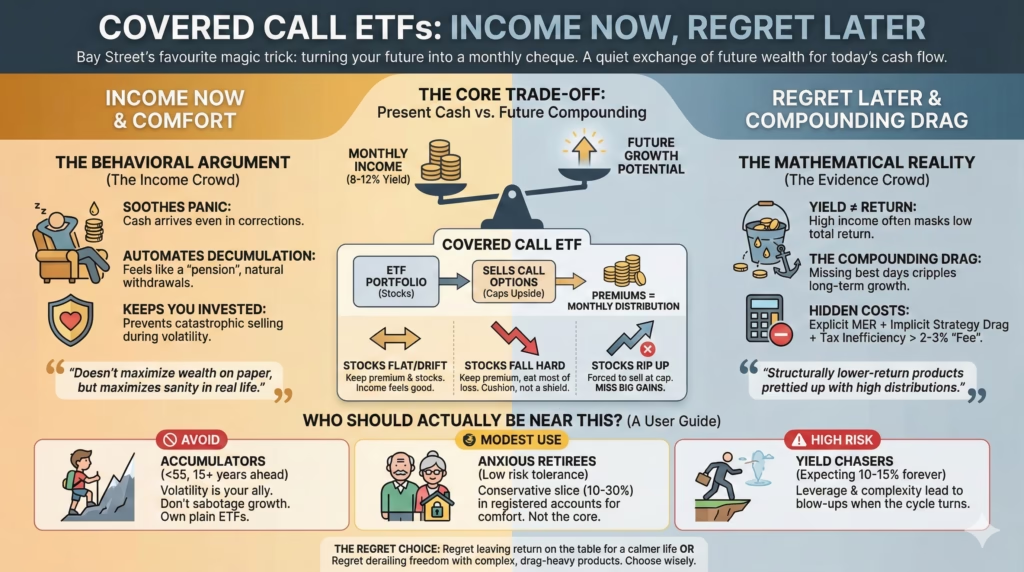
Covered Call ETFs: Income Now, Regret Later
Ben Felix has the math. The income crowd has the cash flow. The truth lives in an awkward, slightly uncomfortable middle.
A quiet civil war on Bay Street
The nastiest fight in Canadian retail investing right now is not over crypto, meme stocks, or some sketchy private REIT.
It’s about boring, heavily marketed covered call ETFs.
On one flank: Ben Felix, CFA, portfolio manager at PWL, patron saint of evidence-based Canadian investing. Multiple videos. Whiteboard math. Long-term data. His verdict on covered call ETFs: “financial bullshit” and a “devil’s bargain” that quietly torches your expected wealth.
On the other flank: an army of yield-focused investors and YouTube channels proudly living off 8–12% cash yields, many of them retired in their 40s and 50s. People like Adrian from Passive Income Investing. They don’t say Felix is wrong. They say he’s answering a question they didn’t ask.
Canadian covered call ETFs have gone from niche to juggernaut. Depending on how the category is defined, assets are now in the tens of billions. BMO, Hamilton, Harvest, Global X, Evolve, CI — all racing to slap “High Income” on a ticker and hoover up retirees’ savings.
The tone online is… not polite.
Accusations of conflict of interest on both sides. Math nerds calling income investors delusional. Income investors calling the math crowd “spreadsheet rich and cash-flow poor.”
The crucial detail: both camps are right about something important. And both are missing something equally important.
Covered call ETFs are not simply “good” or “bad.”
They’re tools. Some investors use them like a hammer. Some use them like a forehead.
The only honest question is:
For which type of investor, under what market conditions, with what behaviour, do these funds make any sense at all?
To answer that, the conversation has to go past slogan level.
What selling calls actually does to your portfolio
Forget the brochure language for a second.
A covered call ETF does two things at once:
- Holds a basket of stocks
- Sells call options on those stocks and pays out the option premiums as “income”
Selling a call option means granting someone else the right (not the obligation) to buy your shares at a set price (the strike) before a certain date. For that right, they pay a premium. The ETF collects that premium and hands it out to investors, usually monthly.
Feels like extra yield. Looks like extra yield. Sounds like extra yield on BNN.
But mechanically:
- If the stock stays below the strike:
The option expires worthless. Premium is profit, and you still own the shares. - If the stock rips higher than the strike:
The ETF must sell at the strike. You get the share price up to the strike, plus the premium… and miss all gains above that level. - If the stock tanks:
The option expires worthless. You keep the premium, but the stock loss dwarfs it.
A simple $100 stock example makes it blunt:
- Stock at $100
- ETF sells a 1‑month $105 call for $2
- Three outcomes:
- Stock ends at $103 → You made $3 on the stock (unrealized) + $2 premium = $5
- Stock ends at $120 → You’re forced to sell at $105; profit is $5 + $2 = $7, while the stock itself went up $20
- Stock ends at $70 → You lose $30 on the stock and keep $2 premium = –$28
Almost full downside. Capped upside.
That payoff shape is not a side effect. It is the entire strategy.
There’s a more technical way to say this:
A call option has “delta” — its sensitivity to stock price moves. Selling a call is like shorting that delta. The ETF is giving away some of the upside exposure of the underlying stocks, in exchange for option premium today.
If equities have a positive long-term expected return — and historically global stocks have returned about 8–10% annually before inflation over many decades — then systematically giving up upside reduces expected return. That’s baked into the structure.
Juicier yields typically come from:
- Writing calls closer to the current price (lower strike)
- Or writing on more of the portfolio
- Or doing it more frequently
- Or adding leverage on top
All of those things also give away more upside.
So:
Higher cash yield now, lower expected total return later.
The question is not whether that trade-off exists. It’s what that trade-off buys in the real world.
The prosecution: the evidence crowd isn’t hallucinating
Ben Felix’s critique rests on a few key claims that are testable and, so far, supported by data.
Start with the obvious one:
1. Yield is not return
The 8–12% yields on many covered call ETFs are not a free lunch.
They’re mostly option premiums generated by selling future upside.
Confusing distribution yield with investment return is the original sin in this space. An ETF can easily pay you 10% in cash while delivering 4–6% total return (or less), because part of what’s being paid out is just your future growth sold off in advance.
Think of it as pawning your upside to fund this year’s groceries.
2. The long-term performance gap is real
Felix and others have shown the numbers repeatedly, and they’re in line with U.S. and global data on covered call indices like the CBOE BXM.
Some examples often cited (numbers approximate, but directionally right):
- BMO Covered Call Canadian Banks ETF (ZWB) vs BMO Equal Weight Banks (ZEB):
About 2–3 percentage points of annual underperformance since 2011. - Global X S&P/TSX 60 Covered Call (HXT-style comparison) vs plain S&P/TSX 60 ETF:
Roughly 3–4 percentage points of annual underperformance in backtests since 2011. - U.S. examples:
- Global X S&P 500 Covered Call ETF (XYLD) vs S&P 500: about 3% per year lag
- JEPI vs S&P 500 since JEPI’s 2020 launch: around 4–6% annual lag when including 2023–2024’s tech-led surge.
Different funds, different periods, same pattern: slower total return.
3. Even if you need income, you can simulate it better
Felix walks through “DIY withdrawal” comparisons:
- Investor A holds a plain index ETF and sells a few units periodically, combining dividends and share sales into a target cash flow.
- Investor B holds covered call ETFs and simply spends the distributions.
When both spend the same amount, the index investor typically ends up with much more capital remaining after 10+ years — often 20–30% more in his examples.
In other words, you can manufacture any income stream you want from a broad ETF by selling units, without locking yourself into the structural drag of covered calls.
4. The implicit fee is huge
One of Felix’s best points is to convert the underperformance into an equivalent “fee”.
If a broad-market ETF charges 0.20% MER while a covered call ETF charging 0.70% MER also gives up an extra 1.5–2.5% in performance drag versus the index, the real cost is more like 2–3% per year.
That makes many of these funds economically worse than the old-school 1990s mutual funds that everyone now mocks.
5. Behavioural demand is being exploited
There’s strong evidence that investors exhibit “mental accounting” — treating income as safer or more “real” than capital gains. According to behavioural finance research (Thaler, Barberis, etc.), investors systematically prefer cash flows they don’t have to actively generate.
It’s not so different from how many homeowners think of their house: they know the mortgage payment cold, can quote local rents, and are oddly fuzzy about long-run total return once you net out upgrades and repairs.
John Campbell, professor at Harvard, has been quoted on exactly this issue: financial markets over-supply products with exaggerated perceived benefits and under-supply those with subtle, long-term benefits.
Covered call ETFs are an almost perfect example: simple story, fat yield, invisible long-run cost.
On the clean economic question —
“Do these strategies lower expected total return compared to the underlying equities?” —
the evidence camp is right. The math says yes. The real-world performance so far says yes.
The defence: being right on paper doesn’t guarantee you win in life
The income camp’s response is not, “the math is wrong.”
Their response is closer to: “that math describes a world where humans act like spreadsheets.”
Real humans don’t.
Two big points from the yield crowd deserve more respect than they usually get.
1. Realized returns depend on staying in the game
Dalbar’s long-running “Quantitative Analysis of Investor Behavior” studies have consistently found that average equity fund investors underperform the funds they own by about 2–4 percentage points per year, due to buying high and selling low.
Over the 30 years to 2023, for example, U.S. equity funds might have returned around 9–10% annually, while the average investor captured more like 6–7%. The gap is mostly behaviour.
If panic selling probability depends on the strategy — and it does — then “expected return” isn’t just the fund’s theoretical return. It’s:
Theoretical Return × Probability of Sticking With It
A rough mental model:
- Broad equity portfolio
- Long-term expected return: say 8–9%
- Probability investor sticks through a 40–50% drawdown: maybe 50–70% at best
- Covered call portfolio
- Long-term expected return: maybe 6–7%
- Probability investor sticks through a 25–35% drawdown: potentially much higher if monthly cash keeps flowing and drawdowns feel less brutal
Plug in hypothetical numbers:
- 9% × 0.6 = 5.4% realized
- 7% × 0.9 = 6.3% realized
Not a formal model. But it makes the point: a “worse” strategy with better adherence can beat a “better” strategy that investors abandon.
High, boring, predictable cash flow smooths nerves, pays the bills during crashes so there’s no forced selling, and reframes bear markets as sale seasons:
“Portfolio’s down, but the cash still hit the account — must be okay.”
This is not something easily captured in an Excel sheet or a 20‑year index backtest.
2. Investing is about funding life, not maximizing terminal wealth
Modern portfolio theory tends to optimize for the size of the pile at the end.
Real people optimize, often clumsily, for:
- Paying the mortgage
- Covering groceries
- Not being a burden on their adult kids
- And maybe a trip somewhere that doesn’t involve an all-inclusive wristband
Consider two retirees, both starting with $1 million:
- Retiree X spends $70,000 a year, largely funded from portfolio income. After 20 years, the portfolio might be worth, say, $600,000–$800,000 depending on returns. But that retiree has consumed about $1.4 million in real-world cash along the way.
- Retiree Y refuses to “touch capital” and lives on government pensions plus minimal withdrawals, leaving the portfolio to compound. Maybe it ends at $3 million after 20 years. Spreadsheet victory. Life… less obviously victorious.
Total-return purists often crown Retiree Y the winner. Many actual retirees would pick X without hesitation.
Covered call ETFs enforce a kind of “autopilot decumulation” — even if nobody calls it that:
- Markets up? Yields funded by option premium plus dividends.
- Markets flat? Option premium is most of the return.
- Markets down? Premiums cushion the fall, and income doesn’t fall in lockstep with prices.
Mechanically, that design moves money from “future possible returns” into “cash you can actually spend now.” Economically expensive. Psychologically satisfying.
Especially for someone in their late 60s who has already won the game financially and cares more about minimizing headaches than squeezing out every last basis point.
When backtests lie: the regime nobody wants to talk about
There is an awkward fact lurking behind a lot of the anti–covered call arguments:
Most of the Canadian data Felix and others use lives almost entirely inside one of the greatest equity bull markets in modern history.
From March 2009 to late 2024, the S&P 500 returned around 14–15% annually including dividends.
The TSX did less, but still very solid. Central banks pinned rates near zero for a decade. Tech stocks transformed from “growth” to “gravity.”
In that kind of world, any strategy that caps upside will, of course, look dumb next to owning the rocket directly.
Covered call indices like the CBOE S&P 500 BuyWrite Index (BXM), where data goes back to the mid‑1980s, tell a more nuanced story:
- In roaring bull markets (like the 1990s, 2010s, and the post‑COVID rebound), BXM lags badly.
- In choppy, sideways, or modest-return decades, BXM can match or occasionally beat the index on a risk-adjusted basis, largely because it harvests volatility.
Look at some historical regimes:
- 1966–1982 (U.S. stocks):
The Dow essentially went nowhere in nominal terms for 16 years, oscillating around 1,000. Inflation ate real returns alive. In that environment, recurring option income on a flat market looks very different. - 2000–2012 (S&P 500):
From the peak of the dot-com bubble to late 2012, the index delivered a “lost decade” with little net progress, punctuated by two savage bear markets. Plenty of volatility, little cumulative gain. - Japan since 1989:
The Nikkei 225 only recently revisited its late‑1989 highs in nominal terms. In real, inflation-adjusted terms, it’s still below. A 30‑plus‑year reminder that “stocks always go up in the long run” can be a very long run.
In those worlds, the cost of capping upside is much smaller, because there just isn’t that much sustained upside to cap. But volatility — the raw material of option premiums — doesn’t vanish.
Now layer in the current backdrop:
- Valuations:
As of late 2024, the S&P 500 trades around 21–22x forward earnings, versus a long-term average closer to 15–16x (FactSet and Yardeni data). Historically, higher starting valuations have predicted lower subsequent 10‑year real returns. - Interest rates:
After four decades of falling yields, the risk-free rate is no longer zero. A 4–5% GIC or government bond changes the opportunity set and compresses future equity risk premiums. - Demographics:
Aging populations in Canada, the U.S., and Europe shift aggregate demand toward income and away from pure growth. More sellers in decumulation, fewer net buyers accumulating.
This doesn’t guarantee a lost decade. It does make repeating 2010–2021’s 15% annual returns less likely.
In 5–7% equity-return world with more volatility and less trend, the relative penalty of a covered call strategy shrinks. The benefit of stable cash flow grows.
That includes the uncomfortable possibility that the past decade’s backtests are the anomaly, not the base case.
The Canadian product zoo: leverage, banks, Bitcoin, and everything in between
Lumping all covered call ETFs into one bucket is a category error. Canada’s lineup now spans from fairly conservative to “this will look heroic right up until it doesn’t.”
A rough (not exhaustive) map.
BMO: the boring adults in the room
BMO’s suite (ZWB – banks, ZWC – Canadian dividend stocks, ZWU – utilities and telecom, etc.) generally:
- Holds large, boring, cash-generating stocks
- Writes calls on only part of the portfolio (often 50–70%)
- Uses no leverage
- Charges MERs roughly in the 0.65–0.75% range
- Targets yields more like 6–8%, not 12–15%
These are “mild covered call” funds. Less yield, more upside participation, less drama.
Global X and the plain-vanilla buywrites
Global X runs TSX and S&P 500 covered call products that look closer to textbook buy-write indices. Systematic overlays, no leverage, full or near-full call coverage, high single-digit yields.
These are the ones that most closely resemble what the academic literature actually studied — and therefore, not coincidentally, the ones that clearly show long-term underperformance vs their underlying indices.
Hamilton: where creativity meets risk
Hamilton ETFs has built an entire brand around “enhanced” high-income strategies:
- HYLD (US) and HDIV (Canada) use:
- Under-the-hood positions in other covered call and dividend ETFs
- Roughly 25% cash leverage
- Derivative overlays The goal: offset the natural drag from selling calls by boosting exposure with leverage, then distributing a double-digit yield.
- The DAY/“DayMAX” series uses short-dated (even zero-days-to-expiry) options that reset daily, in an attempt to capture intraday volatility while allowing more participation in multi-day rallies.
These are engineering solutions to a real problem: how do you keep paying 10–15% and not fall hopelessly behind in bull markets?
The problem is, complexity doesn’t remove risk. Just reshapes it.
Leverage, path dependency, counterparty exposure, and more sensitivity to volatility regimes all show up in ways that are harder for ordinary investors to understand until a nasty, highly specific scenario hits.
Harvest: yield on steroids, concentrated
Harvest offers funds like single-stock covered call ETFs on high-volatility names (e.g., tech, crypto-adjacent stocks) and higher-octane income funds like HHIS that:
- Hold a small basket (maybe 15–20 names) of volatile, growthy stocks
- Write calls for high premium yield
- Charge higher fees than plain ETFs
- Target very high payouts
The thesis:
More volatility → richer option premiums → more ability to offset the lost upside.
The catch:
More volatility also means heavier drawdowns when momentum unwinds.
And concentration means idiosyncratic shocks hurt more.
Evolve, CI, others: hybrids and niche plays
Other providers mix and match: partial call overlays, sector-specific products, global equity income, even Bitcoin covered call ETFs.
The main takeaway:
Saying “covered call ETFs are bad” is like saying “cars are bad” while simultaneously talking about a Corolla, a delivery van, and a tuned street racer in the same breath.
And this is important — complexity generally flows in one direction: toward higher-fee, higher-yield products that are harder to understand and easier to mis-sell.
The quiet killers: taxes, fees, and path dependence
Three issues get shoved under the marketing carpet.
1. Taxes: the yield is not just “more”
In Canada, tax treatment matters a lot:
- Eligible Canadian dividends get the dividend tax credit
- Capital gains are only 50% taxable
- Interest and many forms of foreign income are fully taxable
Covered call distributions are usually a mix:
- Option premium (which can be taxed as capital gains in some structures)
- Dividends from underlying stocks
- Return of capital (ROC)
ROC looks nice — no immediate tax. But it reduces the adjusted cost base of the units, setting up larger capital gains later when you eventually sell. Tax leakage is hard understand in real time.
Also: many high-income ETFs hold U.S. and global securities. Foreign withholding taxes inside a Canadian ETF held in a taxable account (or sometimes even in an RRSP/TFSA, depending on structure) can quietly erode net yield.
A solid, diversified total-return portfolio can often be arranged in a way that:
- Realizes gains more flexibly
- Harvests tax losses in bad years
- Uses lower-turnover strategies with more control over when taxable events occur
Covered call ETFs do a lot of taxable stuff on autopilot. For someone in a high marginal bracket, that can materially change the story.
2. Fees: small percentages, huge outcomes
A 0.70–0.90% MER on a high-yield ETF feels tolerable.
Add in:
- Implicit strategy cost (lost upside)
- Trading costs baked into option writing
- Foreign withholding taxes
- And the opportunity cost relative to a 0.05–0.25% broad ETF
Over a 25–30‑year retirement, a 2% annual drag can consume 40–50% of terminal wealth. According to Vanguard’s own long-horizon projections, even 1% fee gap compounds to enormous differences.
The yield crowd often shrugs and says, “who cares about terminal wealth, it’s about income.” Fair — up to a point. Once the fee and drag reach high enough levels, income itself becomes less sustainable.
3. Path dependence and sequence risk
Sequence of returns risk — the order in which returns arrive — matters enormously in retirement.
A retiree unlucky enough to hit:
- A 40% market crash in the first 3–5 years of withdrawals
- Combined with inflation
- Combined with panic selling
…can blow up a seemingly safe withdrawal rate.
Covered call funds theoretically help by:
- Reducing participation in extreme upside
- Slightly cushioning downside with premium
- Keeping cash flow coming during downturns
But path dependence cuts both ways:
- If equity markets surge early in retirement (like 2010–2021) and then stagnate later, a covered call investor may permanently miss the compounding of that early decade and end up much poorer two decades in.
- Conversely, for a retiree heading into a choppy, sideways decade like 2000–2010, covered calls might deliver higher realized cash returns with less emotional trauma.
The problem: nobody knows ahead of time which path shows up. If anything, the expected path now looks less like 2010–2021 and more like a muddier, lower-return version.
So… who should actually own this stuff?
Strip away the marketing and the tribal warfare, and a more nuanced map appears.
Covered call ETFs can be:
- Very harmful for some investors
- A reasonable compromise for others
- And a niche, tactical tool for a minority who understand the mechanics
A few archetypes.
Probably the worst fit
- Young accumulators with long horizons (20–40 years)
- Anyone still adding new savings monthly
- Investors who don’t need income yet and can tolerate volatility
- Households aiming to maximize long-run wealth or leave sizable inheritances
For them, the upside drag is pure self-sabotage. These kind of funds lock in mediocrity where time and volatility are actually allies.
Borderline to dangerous
- Investors who see “12% yield” and think that is the long-term total return
- People loading up on multiple leveraged high-income ETFs without understanding that many own each other or the same underlying stocks
- Anyone using margin or borrowing to buy these funds on top of the built-in risks
When the next serious bear market or credit event hits, the combination of leverage, opaque structures, and behavioural panic can get very ugly.
Reasonable but imperfect use-cases
- Late-stage accumulators with anxiety problems
- Age 55–65
- Reasonable savings, some portfolio trauma from 2008 or 2020
- Constant temptation to de-risk at the worst times A modest allocation to conservative covered call products (think BMO-style, no leverage, partly overwritten) on top of a core index portfolio may help them stay invested at all.
- Retirees who genuinely value stable cash flow over maximum legacy
- Comfortable but not ultra-wealthy
- No strong bequest motives
- Prefer predictable monthly deposits to the mess of ad-hoc selling For this group, covered call ETFs can function as a kind of private pension augmentation, especially if blended with safer assets.
- Investors in a tax-sheltered account prioritizing simplicity
- Using RRSPs, RRIFs, TFSAs
- Will pay little or no ongoing tax on distributions
- Want “one-decision” products, even at the cost of long-term efficiency Here, at least the tax drag is contained. The remaining debate is purely between comfort today vs. wealth tomorrow.
None of these are slam dunks. But in the real world, “second-best and sustainable” routinely beats “optimal but abandoned in year seven.”
A blunt playbook for using (or avoiding) covered call ETFs
Some directional guidance, minus the handholding.
1. Decide what game is being played
Two different games often get mixed together:
- Wealth maximization
- Lifestyle funding and emotional stability
If the priority is:
- Long horizon
- Compounding
- Leaving money to kids or charity
→ Covered call ETFs drag on the core portfolio. Use broad, low-cost equity and bond ETFs instead. Manufacture “income” by selling units when needed.
If the priority is:
- Sleep
- Simple cash flow
- Spending while alive
→ A controlled dose of covered call income, combined with simple fixed income, can be a legitimate trade-off — as long as expectations are brutally realistic.
2. If using them, avoid going “full yield cult”
Practical caps that help avoid stupidity:
- Keep high-octane covered call/leverage income ETFs to, say, 10–30% of the total portfolio, not 80–100%.
- Stick to underlying exposures you actually understand (banks, utilities, broad markets) before venturing into crypto-adjacent or hyper-growth single stock overlays.
- Leverage on top of leverage is not “enhanced income,” is enhanced blow-up potential.
If a product name contains: “Enhanced,” “MAX,” “Ultra,” and “High Income” in some combination, it’s often safer to assume the risk is higher than the brochure suggests.
3. Prefer transparent, lower-complexity structures
All else equal:
- No leverage > leverage
- Partial overwrite > full overwrite
- Broad, liquid underlying indices > concentrated or exotic baskets
- Lower MER > higher MER
Complexity should have to earn its right to exist. Most doesn’t.
4. Match the account type to the product
- Taxable accounts: be very cautious.
- Focus on tax-efficient, lower-turnover total-return strategies.
- If using covered calls, understand how distributions are classified (dividends vs capital gains vs ROC vs other income).
- Registered accounts (RRSP, TFSA, RRIF):
- Less worrying about annual tax drags.
- Still need to care about foreign withholding taxes and hidden costs, but the worst damage is mitigated.
5. Run the numbers in dollar terms, not yield terms
Instead of, “This fund yields 11%, amazing,” ask:
- What has the 5–10 year total return been vs a plain ETF?
- If the underlying index returns 6–7% over the next decade, what happens if this thing only returns 4–5%?
- If $500,000 is invested, what’s the difference in dollar wealth after 15–20 years between a 5% and 7% annualized return?
The compounding gap is where the “devil’s bargain” lives, not in whether the cash flow feels good this year.
6. Build a written rule for when to sell (or not)
Behavioural blowups are more dangerous than fee drag.
Before buying a high-income ETF:
- Decide what kind of drawdown will trigger a review (say –25% or worse vs purchase).
- Decide what will not trigger panic selling (markets down, scary headlines, one bad year).
- Make it explicit: “This position may underperform badly in a roaring bull market. That is the price of income. It will not be sold for underperforming in up years.”
That kind of pre-commitment, even in a notebook, often matters more than picking the “best” yield product.
Stepping off the yield roller coaster
Covered call ETFs are neither financial poison nor a miracle income machine.
They are a way of converting uncertain, potentially higher future gains into more certain, lower expected returns and higher cash flow today.
Mathematically, that’s a losing trade if the only goal is to maximize terminal wealth. Behaviourally, it can be a winning trade for specific people facing specific fears, especially in a world where most investors already fail the “stay the course” test.
The uncomfortable, unsexy stance looks something like this:
- For anyone under 55 still building wealth:
Skip them. Own broad, low-cost ETFs. Learn to tolerate volatility. Manufacture income only when needed. - For retirees and near-retirees who obsess over monthly cash and know they will otherwise panic:
Use covered call ETFs as a component, not the foundation — ideally conservative, partially overwritten ones — alongside bonds, GICs, and plain equity ETFs. - For yield-chasers expecting 10–15% forever with no trade-offs:
That story ends the same way every yield cult eventually ends. Slowly, then suddenly.
Default Setting: Avoid in Accumulation, Use Sparingly in Retirement
In the end, the real question isn’t “are covered call ETFs good or bad?”
The real question is brutally simple:
What is worth more — an extra 1–3% expected return that may never be captured because the strategy gets abandoned,
or a slightly dulled return path that keeps the investor calm, liquid, and willing to stay invested through whatever the next decade looks like?
For the mathematically inclined, that trade-off will always look wasteful.
For some humans with real bills, aging parents, and scar tissue from past crashes, it will look like sanity.
Portfolio design is just choosing — often without realizing it — which regret will sting less later.
The only honest covered call pitch: “You’ll feel richer monthly and poorer yearly. But the monthly feeling comes first, so you probably won’t notice the yearly part until too late.”